An independent analysis of every monthly report DC's Alcoholic Beverage and Cannabis Administration (ABCA) has published since 2020.
Data as of: ABCA's September 2026 report (PDF dated Oct. 15, 2026). Last updated: October 21, 2026.
Explore the dashboard: DC Cannabis Market Data.
September 2026 at a glance
- Dispensary (retail) sales: $6,357,934, down 2.0% from August ($6,489,456) and up 21.6% from September 2025 ($5,227,030). September has been the weakest month of the year on average (2021–2024), so a dip is in line with past seasonality. (DCWeedHub analysis.)
- Registered DC resident patients: 149,199, up 5,643 (3.9%) from August and up 89.4% from September 2025.
- DC residents who bought: 24,381 (about 35 per 1,000 residents, using the 2025 Census estimate), down 2.5% from August and up 31.8% from a year earlier.
- Licensed retailers: 67 (66 in August). Average sales per retailer: $94,895.
- New product category: ABCA added "Beverage" ($11,834 in September) and relabeled "Pill/Capsule/Suppository" as "Pill/Capsule/Inhalable".
- Source: ABCA Medical Cannabis Program Report, September 2026.
The headline
After four flat years of about $33–38 million a year, DC's licensed dispensary sales jumped to $59.34 million in 2025, up 81.5% from 2024. January–September 2026 is running 34.8% ahead of the same months of 2025 ($56.69M vs $42.05M). The change happened almost overnight in spring 2025, as dozens of new licensed retailers opened and the number of registered patients multiplied.
Key findings
1. A step change in spring 2025
Monthly dispensary sales held between about $2.5M and $3.6M from 2021 through February 2025. Then they climbed to $3.68M in March 2025 and $5.46M in April 2025, and have stayed between $5.2M and $6.7M a month since. The record so far is May 2026 ($6.71M). September 2026 came in at $6.36M, down 2.0% from August and up 21.6% from September 2025.
The jump lines up with the March 31, 2025 deadline for previously unlicensed shops that had applied to ABCA to be licensed and operating. (DCWeedHub analysis: ABCA's reports don't state a cause.)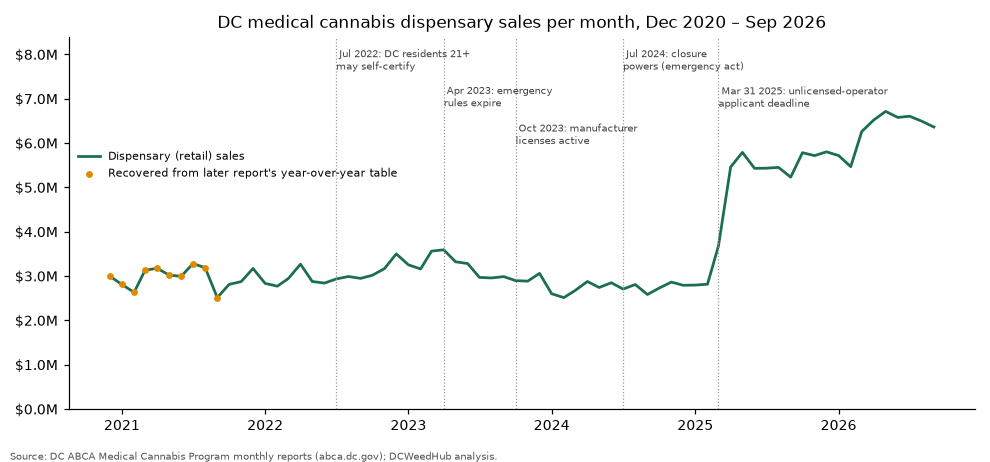
Source: ABCA Medical Cannabis Program Reports, Feb–Apr 2025 and May–Sep 2026; ABCA guidance on the March 31, 2025 deadline.
2. Registered patients have grown five-fold since the end of 2024
ABCA counted 29,677 registered patients in December 2024 and 149,199 in September 2026. Two earlier policy moves show up clearly in the data. When DC residents 21+ were allowed to self-certify in July 2022, the count jumped from 15,730 to 21,051 in a month. When emergency rules expired on April 1, 2023, it dropped from 28,833 to 20,656.
Not every registered patient buys in a given month. In September 2026, 24,381 DC residents made a purchase, about 16% of those registered.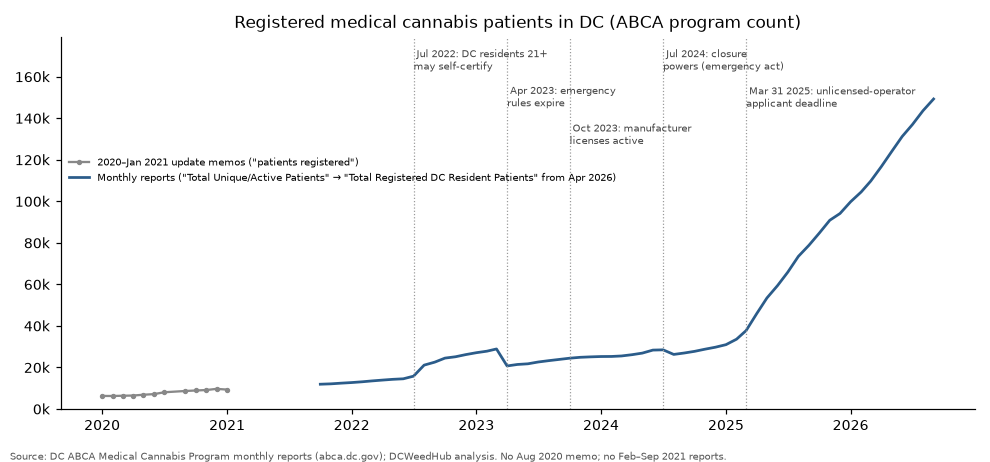
Source: ABCA Program Update memos (2020) and monthly reports (Oct 2021–Sep 2026); D.C. Act 24-469.
3. DC residents now make up most sales, and visitors have switched to self-certification
In December 2021, non-residents accounted for 52.4% of dispensary sales, all of them through out-of-state card reciprocity. By September 2026, DC residents accounted for 62.0%. Visitors using ABCA's self-certified temporary registration made up 31.4%, and reciprocity card holders 6.7%.
Virginia is by far the top home state for temporary registrations (4,195 in September 2026), followed by Maryland (1,863).
Source: ABCA monthly reports, Dec 2021 and Sep 2026 (patient-type sales tables).
4. Many more stores, each selling much less
In December 2020, DC had 7 operating dispensaries, which averaged about $428,000 in sales each that month. In 2026, ABCA reports 64–69 licensed retailers, averaging about $93,000 per retailer per month ($94,895 in September 2026, across 67 retailers). The market has grown, but it's now split among nearly ten times as many stores.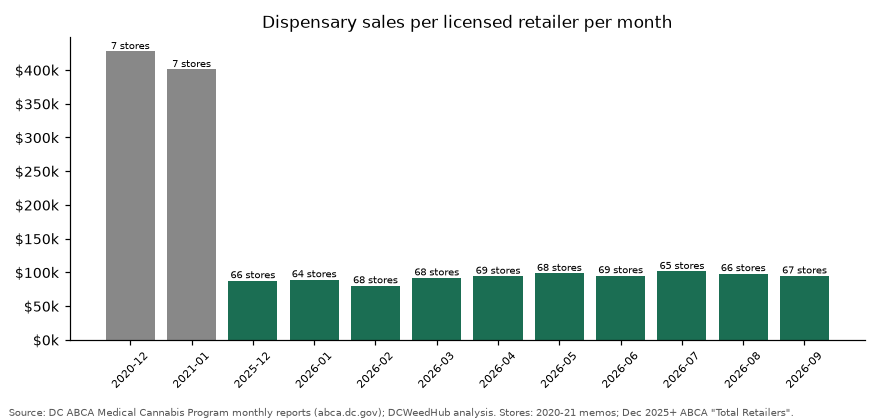
Source: ABCA Program Update memo (Dec 2020) and Dec 2021 report (Dec 2020 sales); ABCA monthly reports, Dec 2025–Sep 2026 ("Total Retailers").
5. Flower's share is shrinking as vapes, edibles and pre-rolls grow
Flower/bud was 65% of retail sales value in 2022 and 51% in January–September 2026. In 2026 so far, vape cartridges are 18%, edibles 12%, and pre-rolls 11%. (ABCA added several product categories in September 2023, so part of this shift comes from reclassification.)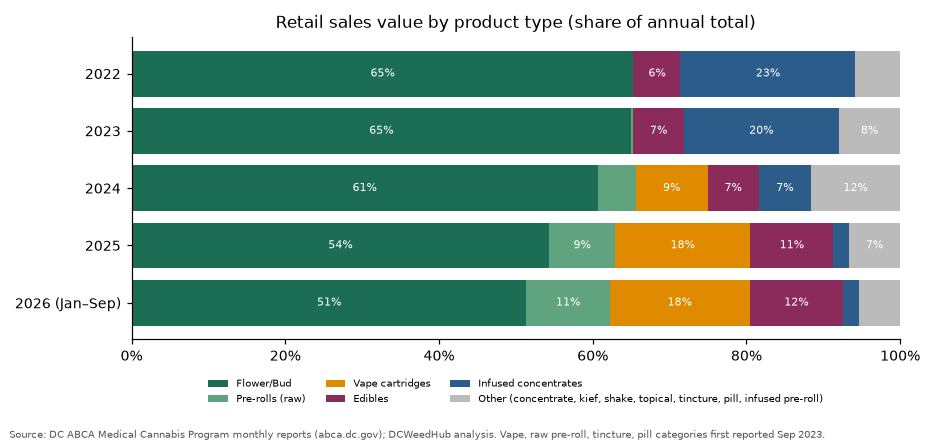
Source: ABCA monthly reports, "Product/Retailer Sales by Type" tables, Jan 2022–Sep 2026.
6. Where the stores are, and where closures happened
ABCA's register lists 79 licensed retail records: Ward 2 has 20, Ward 1 has 17, Ward 6 has 14, Ward 4 has 11, Wards 3 and 5 have 6 each, Ward 8 has 3, and Ward 7 has 2. ABCA also reports 113 unlicensed facilities closed to date. Ward 1 has the most closures (36).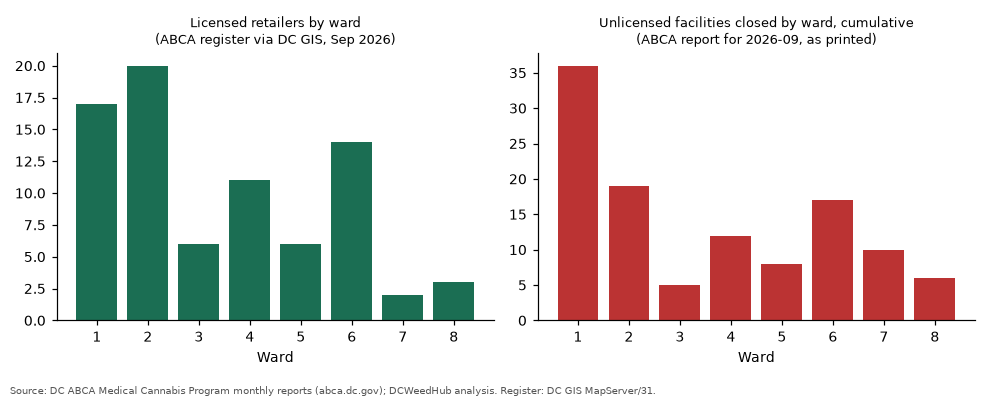
Source: ABCA Licensed Medical Cannabis Retailers register via DC GIS (retrieved Sept. 29, 2026); ABCA Sep 2026 report, "Unlicensed Facilities Closed per Ward".
Also worth knowing
- Seasonality: from 2021 to 2024, April was the strongest month (about 9% above the yearly monthly average) and September the weakest (about 7% below).
- Transactions grew faster than sales: total patient transactions rose from about 29,000 (Dec 2024) to about 94,000 (Sep 2026), about 3.2×, while sales rose about 2.3×.
Methodology
- Source data: every monthly Medical Cannabis Program Report ABCA has posted: 2026 at abca.dc.gov/page/medical-cannabis-metrics-2026, plus the 2025, 2024, 2023, 2022, 2021 and 2020 pages linked from ABCA's Program Metrics page. That's 72 PDFs, covering January 2020 through September 2026.
- Extraction: we converted the PDFs to text and pulled each table value into a dataset. Each value records the report and the line it came from. We checked the numbers against each other: in all 60 months where they can be compared, the patient-type sales add up to ABCA's dispensary total.
- What "sales" means here: we use ABCA's "Dispensaries" line (retail sales to patients). ABCA's "Total" line also adds cultivator and manufacturer sales, which are mostly wholesale sales to dispensaries, so we don't use it as the market size.
- Gaps: ABCA hasn't posted monthly reports for February–October 2021. We recovered sales for those months from the year-over-year tables in ABCA's 2022 reports, but patient figures for those months aren't available. ABCA also changed some labels and categories over time. These changes are flagged where they matter.
- Interpretation: statements about why something changed are DCWeedHub's analysis and are labeled as such. ABCA's reports don't give causes.
- Store counts by ward use the ward field in ABCA's licensed-retailer register (published through DC GIS / Open Data DC).
- Full data, code and a QA log are available on request.
Sources
- ABCA, Medical Cannabis Program Report, September 2026 (PDF dated Oct. 15, 2026): https://abca.dc.gov/sites/default/files/dc/sites/abra/documents/MCP%20Report%20-%20September%202026.pdf
- ABCA, Medical Cannabis Metrics 2026 (monthly reports index): https://abca.dc.gov/page/medical-cannabis-metrics-2026
- ABCA, Program Metrics pages for 2020–2025 (linked from the metrics page above)
- ABCA Licensed Medical Cannabis Retailers register, DC GIS layer 31 (retrieved Sept. 29, 2026): https://maps2.dcgis.dc.gov/dcgis/rest/services/DCGIS_DATA/Health_WebMercator/MapServer/31
- D.C. Act 24-469 (self-certification): UNKNOWN URL. The live page cites it without a link. Editor: add the DC Law Library link.
Related: August 2026 market report · DC dispensary data by ward · Why Congress blocks recreational sales · Find a licensed dispensary · Register first: start your ABCA registration
About this report
DCWeedHub is an independent publication. We are not affiliated with, endorsed by, or speaking for ABCA or the DC government. This report summarizes public data for general information. It is not legal or medical advice. Figures may change if ABCA revises its reports.